GW1100 Antenna Placement

I’ve been doing some experiments in finding the optimal placment of the GW1100 gateway. The gateway receives radio signals from Ecowitt weather instruments in the field: anemometer, UV, light, air & soil temperature, humidity, rain as well as in-house temperatures, barometric pressure and indoor pm2.5, does a few local calculations, hosts a small set of web pages, and makes the data available over the in-house intranet. If the signals from the instruments are too weak or attenuated (by distance, metal screens, water walls or dense construction). that data is lost.

I noticed when I added the meadow soil temperature instrument (an Ecowitt WN34S) last week, that the readings were erratic, so I checked on the strength of the signal, and eventually graphed all of the signals on our in-house WeeWx web page. I first moved the GW1100 to an upstairs rear window. Anemometer signals were better, but rain and T&H outside worse. I tried a back room on the lower floor and that may turn out to be optimal. I’ll continue to test.

Overnight signal results from moving the GW1100 to different windows


Signal strength is reported by the GW1100 in a scale of zero to four. and the WeeWX software graphs an average value The nearby in-house “Upstairs” and “Basement” temperature/humidity sensors (two Ecowitt WH32) always have a strong signal. The outdoor T&HP sensor (Ecowitt WH31_EP) was good when the GW1100 was in north-facing windows at the front or back of the house, but signals were poor around 1600 when I tried the upstairs placement. The anemometer (an Ecowitt WH68) has never been very strong, as it is the furthest away, and behind a metal-roofed garage. When the GW1100 was upstairs the signal appeared the strongest, but the rain gauge and outdoor T&H were notably weaker.

GW1100 web page showing devices, IDs and signal strength
Sensors showing IDs and signal strength for anemometer, rain gauge and outside temperature and humidity
GW1100 web page showing devices, IDs and signal strength
GW1100 web page showing devices, IDs and signal strength for “Upstairs” and “Basement” T&H
GW1100 web page showing devices, IDs and signal strength
GW1100 web page showing devices, IDs and signal strength for meadow soil temperature

Alert readers (I see you out there!) will wonder why I didn’t just use the internal web pages of the GW1100 that display a “signal” column, shown above. The problem with those is that the signal strength appears to be averaged over time, and not as immediately responsive as the graphs I generated with WeeWX. Overnight, all of the signal scores caught up, and all are displaying four bars in the morning.

Fall upkeep

The autumn season turned startlingly fast with morning temperatures dropping into the 40s, so it’s time to do the upkeep and maintenance on the outside instruments before winter weather makes them inaccessible. Today, I replaced the AA battery in the anemometer. I use lithium batteries for the outdoor instruments, as they are long-lasting, and tolerate a wider range of temperatures.

Added a new Soil Temperature sensor

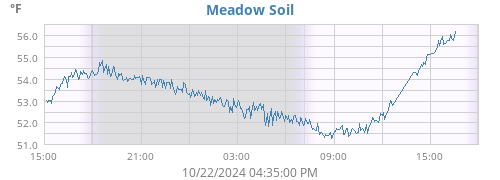
One of our home landscaping projects is to recover an area overrun by bittersweet vine, and we’re going to try to establish a wildflower meadow. Following instructions from the seed vendor, we were told to track the soil temperature. Ecowitt sells the WN34S soil temp probe, and it was pretty simple to power it up and get it to display on our in-house monitors.

Pine Pollen Clouds

Not strictly a meteorological issue, but certainly an air quality issue! The slightest breezes were launching clouds of yellow pollen out of the pine trees, and the air was so hazy I was looking for a fire. Take precautions if you, like me, suffer spring allergies.

Fixed the River Levels page

Thanks to Ken True of Saratoga-weather.org, an updated script to display river levels is in place. The NOAA has replaced a couple of older systems with inconsistent APIs and data formats with a new and improved system. Note that for the moment, you need to click to close the update message and the legend that take up half the display, but that should be temporary.

Screen capture of the River levels page with an embedded page of the National Water Prediction Center. An informational message about updates take up the top sixth of the screen, while the map legend slides in from the right and obscures half the map

/

Happy CoCoRaHS anniversary!

Today marks three years since I started recording CoCoRaHS — Community Collaborative Rain, Hail and Snow network — daily observations, missing only one day so far. Today was an observation of 11 inches of snow in the field, 5.7 on the snowboard, and water equivalents of 0.69″ on the board and 1.55″ in the field measurement. That’s a lot of water!

Milestone: snowpack gone

Not as exciting as “ice out” on the big lakes, but today was the first day I didn’t bring out the snowpack ruler since winter started. Spring is on its way!

A glitch in the matrix

An update to the GW1100 firmware, version 2.3.1, enabled the gateway to “see” the WH32 (indoor temp, humidity and pressure) sensor instead of the built-in T&H sensors in the GW1100, and made that option the default. After the update, the calibration settings for the barometer appeared to change on their own, and the resulting reported barometric pressure was off. A quick search of the great posts on wxforum revealed this was a known issue and provided a fix: disable reading the newly-available WH32. Done!

Weather Band webinar: Winter Lake-Effect Systems: Scientific and Educational Adventures to Further Our Knowledge and Prediction of Lake-Effect StormsWeather Band webinar:

On the 17th of this month, I attended a webinar on Lake Effect Systems and the studies going on. A number of distinguished meteorologists taked about the team effort to study LES on Lake Ontario a few years ago. The PhDs gave great credit to their hard-working undergrads who braved difficult winter conditions to set up and manage all of the tools and instruments and trucks and vehicles to gather all of the data. While the technical details were beyond my current understanding, the core ideas were quite accessible and interesting.

Hosted by the Weather Band, a group of “weather enthusiasts,” mostly non-meteorologists, run by the American Meteorological Society.